Results
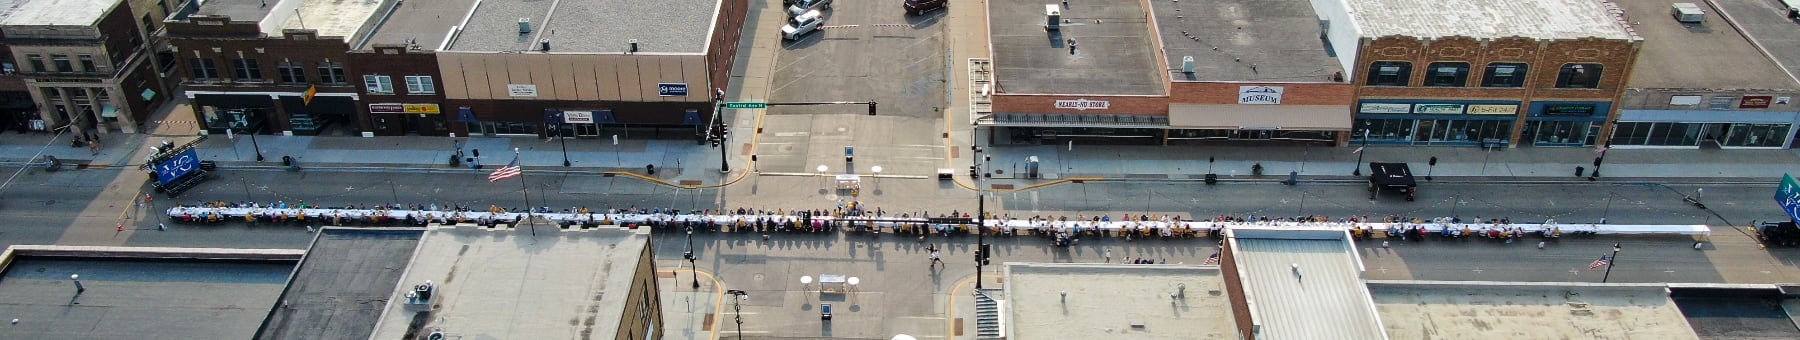
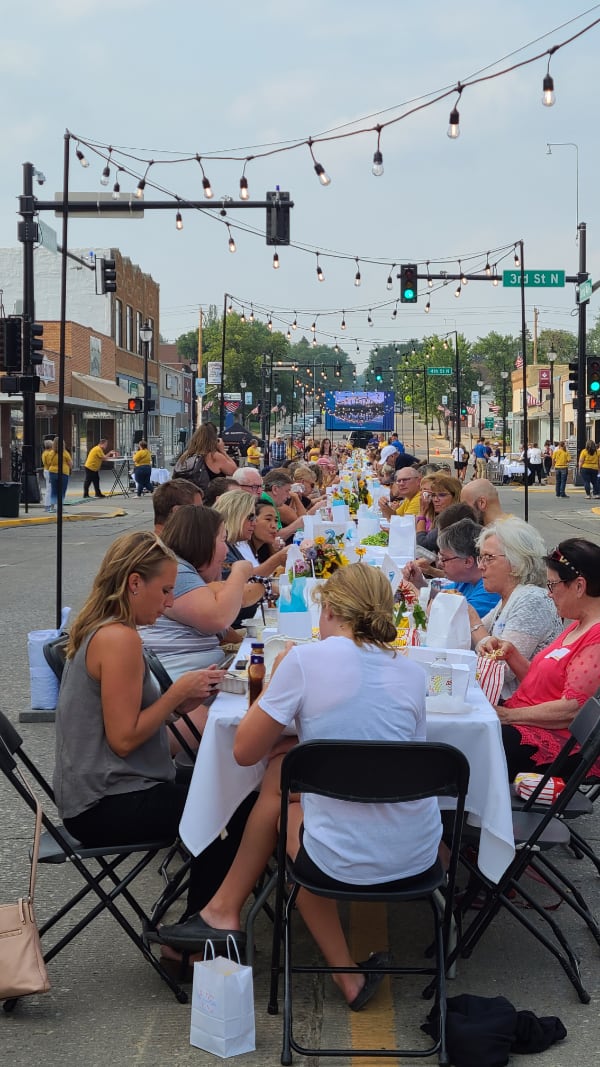
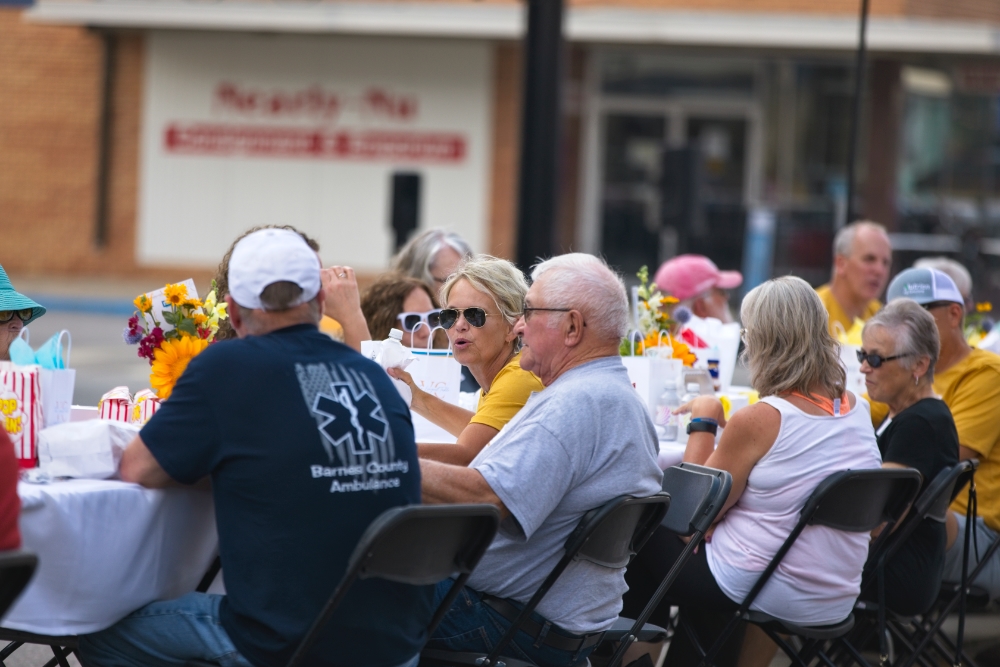
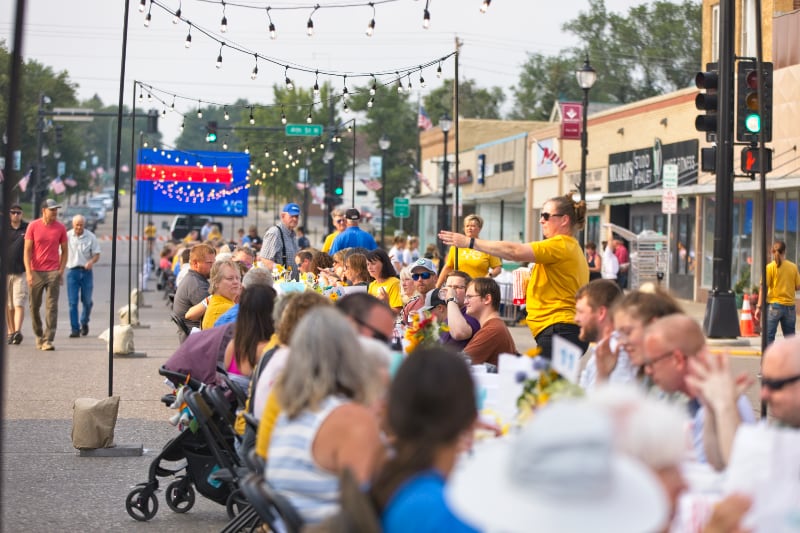
On August 5, 2021, just under 300 Valley City area residents gathered down Central Avenue to join in a facilitated conversation to exchange stories and share ideas about community innovation all while building stronger connections with their neighbors.
Attendees were asked to complete a survey before and after the conversation to gather data about our community specifically regarding amenities, engagement, image, and quality of life. The data reflects feedback and results pertaining to community amenities, improving our future, and activities to build the quality of life for our community and those who come to enjoy it.
These charts are interactive. Click on a bar or a selection box to see how the attribute in the bar you selected reflects across all categories.
Community Perception
Attendees were asked various questions to gain perspective on their perception of our community. Some of the highlights include:
77% agree they are happy and proud to call Valley City Home
50.9% agree Valley City is welcoming while 40.13% somewhat agree
51.59% somewhat agree that it is easy to start a community project while 24.3% somewhat disagree
48.41% Agree they would like to help and support a community project if the opportunity arose. 45.86% somewhat agree
54.78% agree Valley City has a bright future and 36.94% somewhat agree
52.23% said their perception was more positive after the conversation.
Project Success
Microgrant projects are currently being conducted. Results from those projects will be updated upon their completion.
"Just wanted to say congratulations, you pulled it off in great fashion. I heard so many positive responses and people want to do this again."
"Thank you for organizing the Longest Table. It was a great event bringing people together, sharing ideas about Valley City and meeting new people. Your time and efforts paid off!"
"Congratulations on a wonderful event last evening. I heard many positive comments...about how it was organized, the meal, etc. Lots of great conversations going on! Thank you for all the work that you put in! "
